

TOKYO, JAPAN — Dentsu Inc. today announced that it has conducted its fourth Consumer Survey on the Sustainable Development Goals (SDGs; hereinafter, “the survey”), which was carried out by Dentsu Team SDGs, a Dentsu group-wide working group tasked with promoting projects related to the SDGs.1 The survey gathered data across Japan from 1,400 male and female respondents between the ages of 15 and 79.
The survey compares SDGs awareness rates and information channels with past survey results, while analyzing impressions about the impact of COVID-19 on consumer awareness of SDGs, companies working toward SDGs, and corporate SDG activities in the value chain.
The poll’s key findings are summarized below.
1. Consumer SDG awareness is 54.2%, nearly double that of the third survey2 (January 2020). Among teens, awareness is over 70%.
2. Some 32.4% of respondents have a growing concern about the SDGs due to COVID-19 with a strong intention to use SDG-related products and services. COVID-19 may be a driver of SDGs products and services penetration.
3. Companies proactively engaged in the SDGs potentially have higher employee engagement.
Notes:
1. The goals were adopted by the United Nations Sustainable Development Summit in September 2015. The 193 member countries of the UN General Assembly set the goals, hoping to achieve them between 2016 and 2030. All UN member states agreed on the 17 goals and 169 specific targets, with the objective of solving major global issues and building sustainable societies.
2. The Third Consumer Survey on Sustainable Development Goals was conducted on January 18-19, 2020/ https://www.dentsu.co.jp/en/news/release/2020/0427-010046.html
Survey Findings
1. Consumer SDG awareness is 54.2%, nearly double that of the third survey (January 2020). Among teens, awareness is over 70%.
(Awareness)
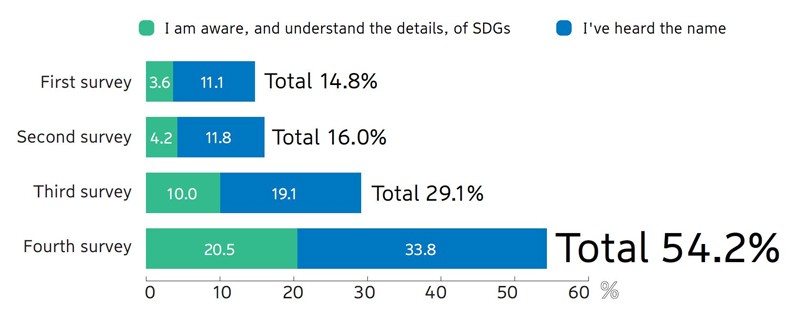
・Awareness of the term SDGs is 54.2%, almost double the third survey’s 29.1%. But only 20.5% of respondents indicate they are aware, and understand the details, of the SDGs. A thorough grasp remains an issue. [Graph 1]
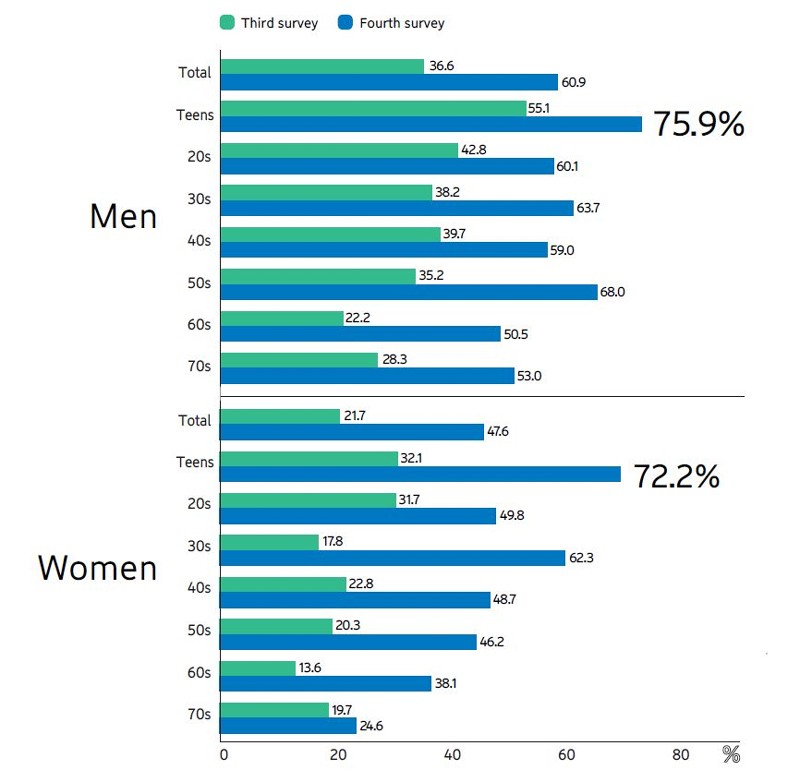
・By gender and age, SDG awareness among teens exceeds 70% (men, 75.9%; women, 72.2%), the highest among all age groups. [Graph 2]
The percentage of respondents who are aware, and understand the details, of SDGs is also high among teenage males (45.7%) and teenage females (31.1%). This indicates the same high level of awareness and understanding among young people as in the third survey.
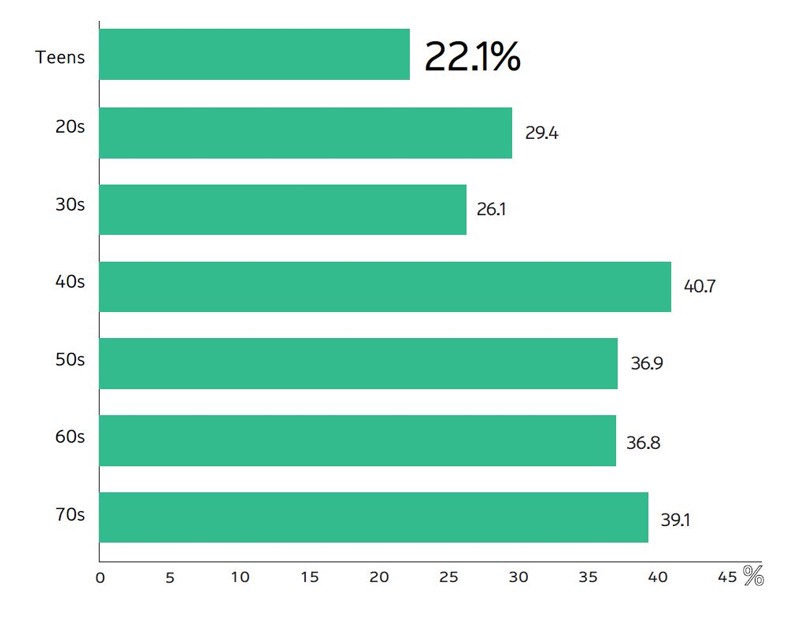
In addition, teens (22.1%) are the fewest among all age groups stating that they face major hurdles to taking action in terms of practical SDG-related activities. [Graph 3]
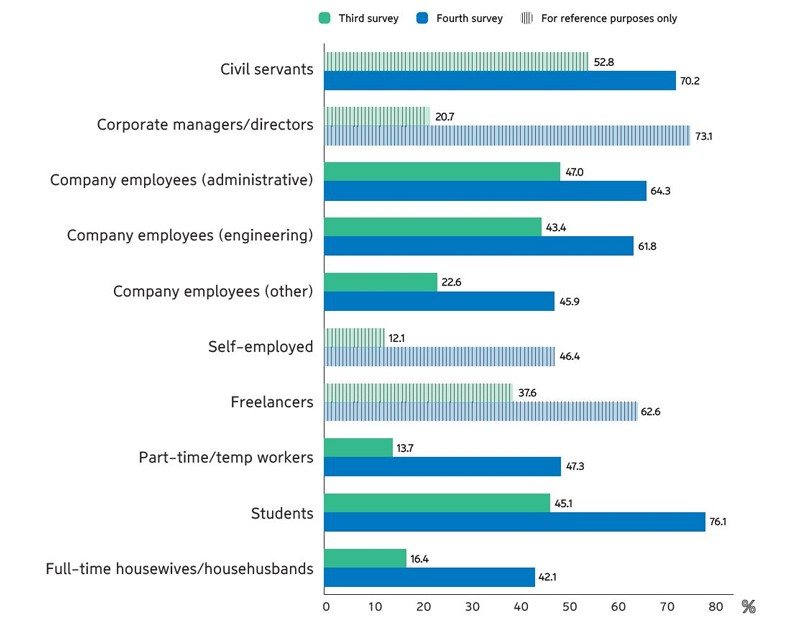
・By occupation, students (76.1%), civil servants (70.2%), and office workers (64.3%) show the highest awareness. SDG awareness among full-time housewives/househusbands is 42.1% (up 25.7 percentage points). This suggests an increase in the number of pathways to awareness outside classrooms and workplaces. [Graph 4]
・By gender and age, compared with the last survey, the rate of SDG recognition has risen significantly among women in their 30s (up 44.5 percentage points), female teens (up 40.1 points), and men in their 50s (up 32.8 points). By occupation, awareness rates increased among part-time workers (up 33.6 points), students (up 31.0 points), and full-time housewives/househusbands (up 25.7 points). [Graphs 2 and 4]
(Pathway to awareness)
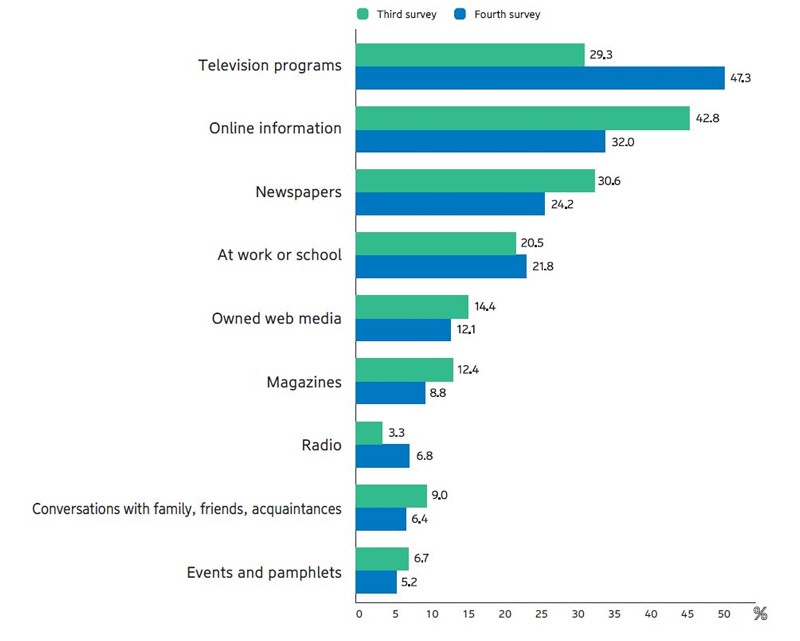
・The top pathways to SDG-related awareness are television programs (47.3%), online information3 (32.0%), and newspapers (24.2%). There is a sharp increase in the role played by television programs since the third survey (up 18.0 percentage points), thought to be due to an increased number4 of SDG-themed television programs and program segments. [Graph 5]
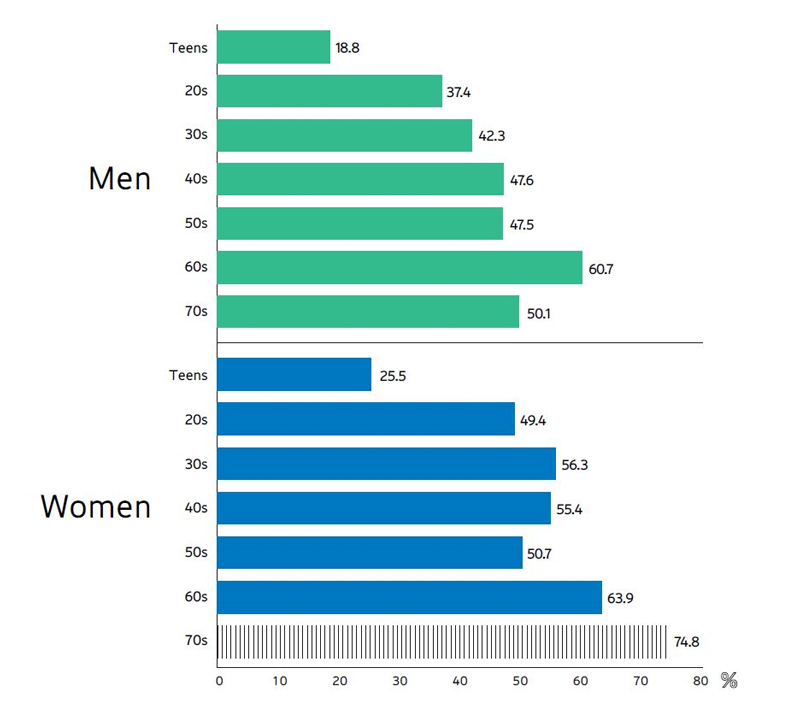
・By gender and age, the most respondents giving television programs as their pathway to awareness are women in their 60s (63.9%), followed by men in their 60s (60.7%), and women in their 30s (56.3%) [Graph 6].
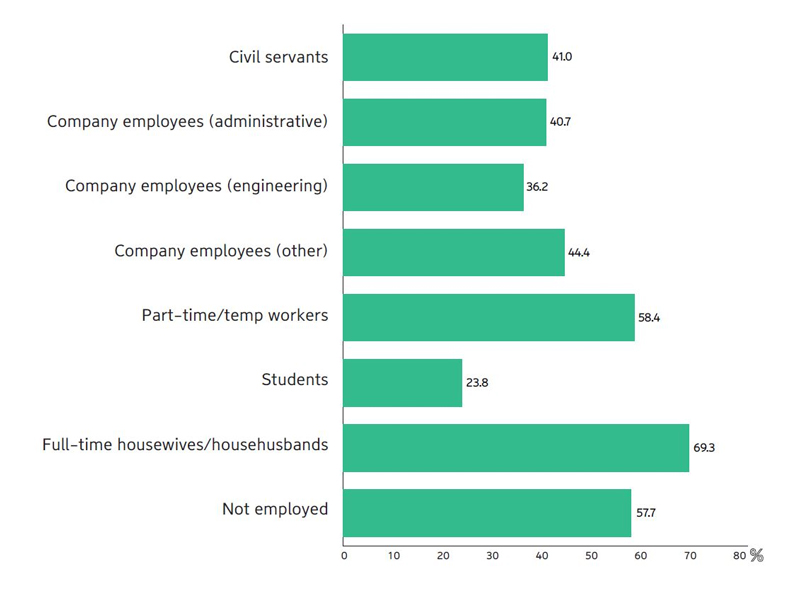
By occupation, the majority are full-time housewives and househusbands (69.3%). [Graph 7]
Notes:
3. News websites, curated media, and other sources.
4. In the Kanto and Kansai regions, 117 terrestrial television programs and program segments featuring SDGs were broadcast in 2019, and 493 in 2020. (Source: Dentsu research)
2. Some 32.4% of respondents have a growing concern about the SDGs due to COVID-19 with a strong intention to use SDG-related products and services. COVID-19 may be a driver of SDGs products and services penetration.
・Of the respondents, 32.4% indicate growing concern about SDGs due to COVID 19. By gender and age, most respondents are women in their 70s (45.4%), followed by those in their 60s (44.6%), and in their 30s (40.0%). [Graph 8]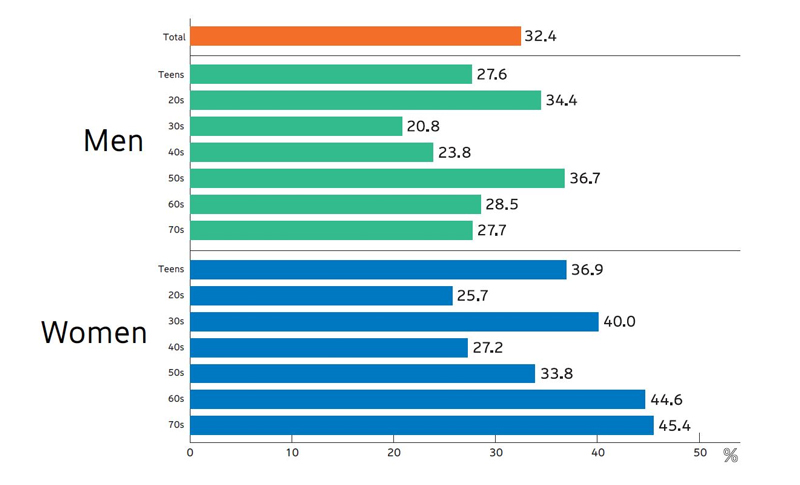
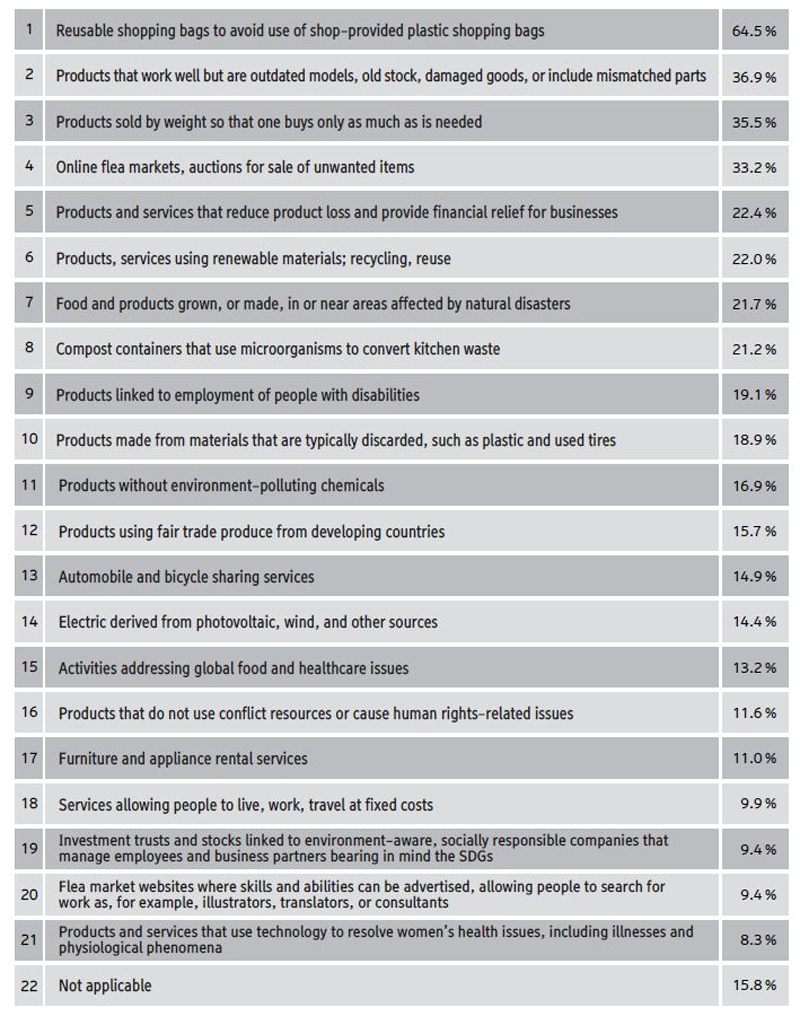
・In order, the top-ranked SDG-related products and services respondents indicated they would like to try in the future are reusable shopping bags brought from home to avoid use of shop-provided plastic shopping bags (64.5%), products that are functional but are outdated models, old stock, damaged goods, or include mismatched parts (36.9%), and products sold by weight so that one buys only as much as is needed (35.5%).
・The intention to use SDGs-related products and services is the highest across all options among those respondents indicating a growing concern about SDGs due to COVID-19, compared with respondents who are not concerned (no change + less concerned).
The major differences in intention to use are products made from materials that are typically discarded, such as plastic and used tires (difference: 12.3 percentage points), products and services that reduce product loss and provide financial relief for businesses (difference: 11.8 points), and activities addressing global food and healthcare issues (difference: 11.3 points). [Graph 9]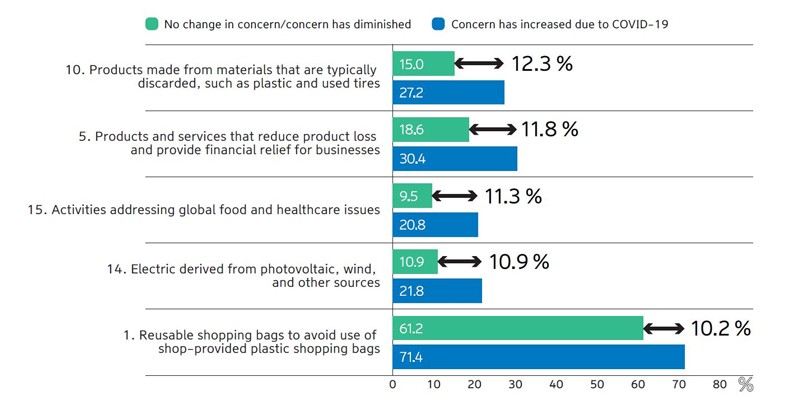
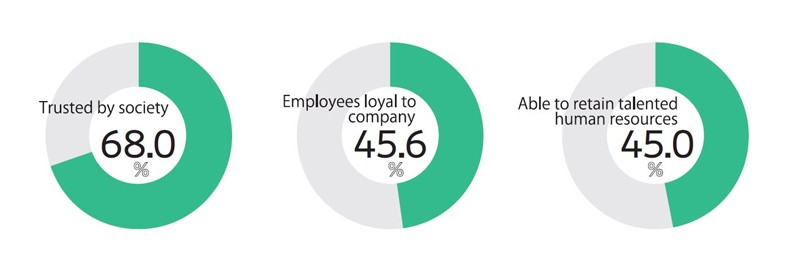
3. Companies proactively engaged in the SDGs potentially have higher employee engagement.
・Among employed respondents asked their impression of companies working toward the SDGs, the most common response is trusted by society (68.0%). Employee loyalty to company (45.6%) and retention of talented human resources (45.0%) suggest that a company’s efforts to realize SDGs may help increase employee engagement. [Graph 10]
・Meanwhile, among those employed by an organization 44.8% of respondents indicated awareness of employers’ SDG initiatives suggests that internal communication is important.
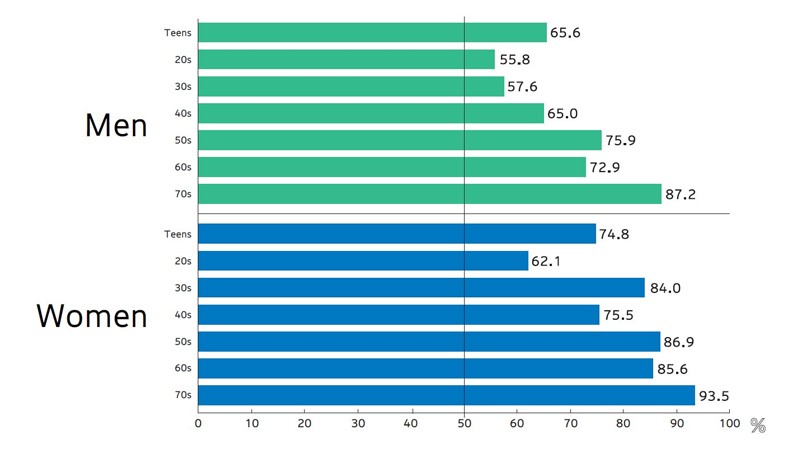
・Regarding corporate SDG-related activities in the value chain, 74.9% of respondents say that activity awareness improves company image.
In terms of respondents’ gender and age, women in their 70s (93.5%), men in their 70s (87.2%), and women in their 50s (86.9%) ranked highest. [Graph 11] This suggests the merit of disseminating information about corporate SDG-related activities throughout the value chain, where the activities are generally seen to be less pervasive.
・In terms of specific initiatives, in descending order are: donating a portion of sales to developing countries and environmental protection groups, and contributing to the adoption of hygienic habits and environmental conservation (42.9%); appropriate use of raw materials to maintain forests and marine environments (42.1%); and technological developments that reuse CO2 as a material and fuel to reduce the release of CO2 into the atmosphere (41.3%).
Comment by Mr. Maher Nasser
Director, Outreach Division & Commissioner-General of the United Nations at Expo 2020
Department of Global Communications
United Nations
“Our work to support Member States achieve the Sustainable Developments Goals by 2030, and therefore fulfill the commitments of World Leaders who adopted them at the UN in September 2015 starts with increasing awareness about the SDGs and ends with mobilizing actions to achieve them. This is why we greatly value the year-on-year awareness survey conducted by Dentsu in Japan. The results from the most recent survey, a nearly doubling of SDG awareness from last year and that awareness among teens is over 70%, are heart-warming and would not have been possible without the strong commitments to advance them by public, private and academic entities in Japan. Information, surveys and data are of the utmost importance in the ability of businesses and organizations to better address the needs and expectations of their clients and stakeholders. With these results in hand, comes the challenge of translating higher levels of awareness of the SDGs to enhanced actions and commitments to achieve the 17 Goals by 2030. Achieving sustainability and reducing gender, social and economic inequalities are key pre-requisite to achieving Agenda 2030 and to building a world where everyone thrives in peace, dignity, and equality on a healthy planet. We can do it. We must do it.”
Outline of Fourth Consumer Survey on Sustainable Development Goals
Objective: Investigate the current status of awareness and understanding of the SDGs in Japan, as well as interest in the SDGs. Based on this, consider possible strategies for future promotion of awareness and action relating to the SDGs.
Survey area: Nationwide in Japan
Respondents: Males and females, aged between 10 and 79 years
Sample size: Groups of 100 men and 100 women in each of seven age categories, together comprising 1,400 persons.
For analysis purposes, the sample was weighted in proportion to the distribution of population among Japan’s 47 prefectures, and also in correspondence with the age group ratios for Japan’s population.
Survey method: Internet-based survey
Survey period: January 22-25, 2021
Survey institution: Dentsu Macromill Insight, Inc.
* The figures presented in this press release’s graphs have been rounded to the nearest unit. Consequently, some totals do not match the sum of the data components shown.